

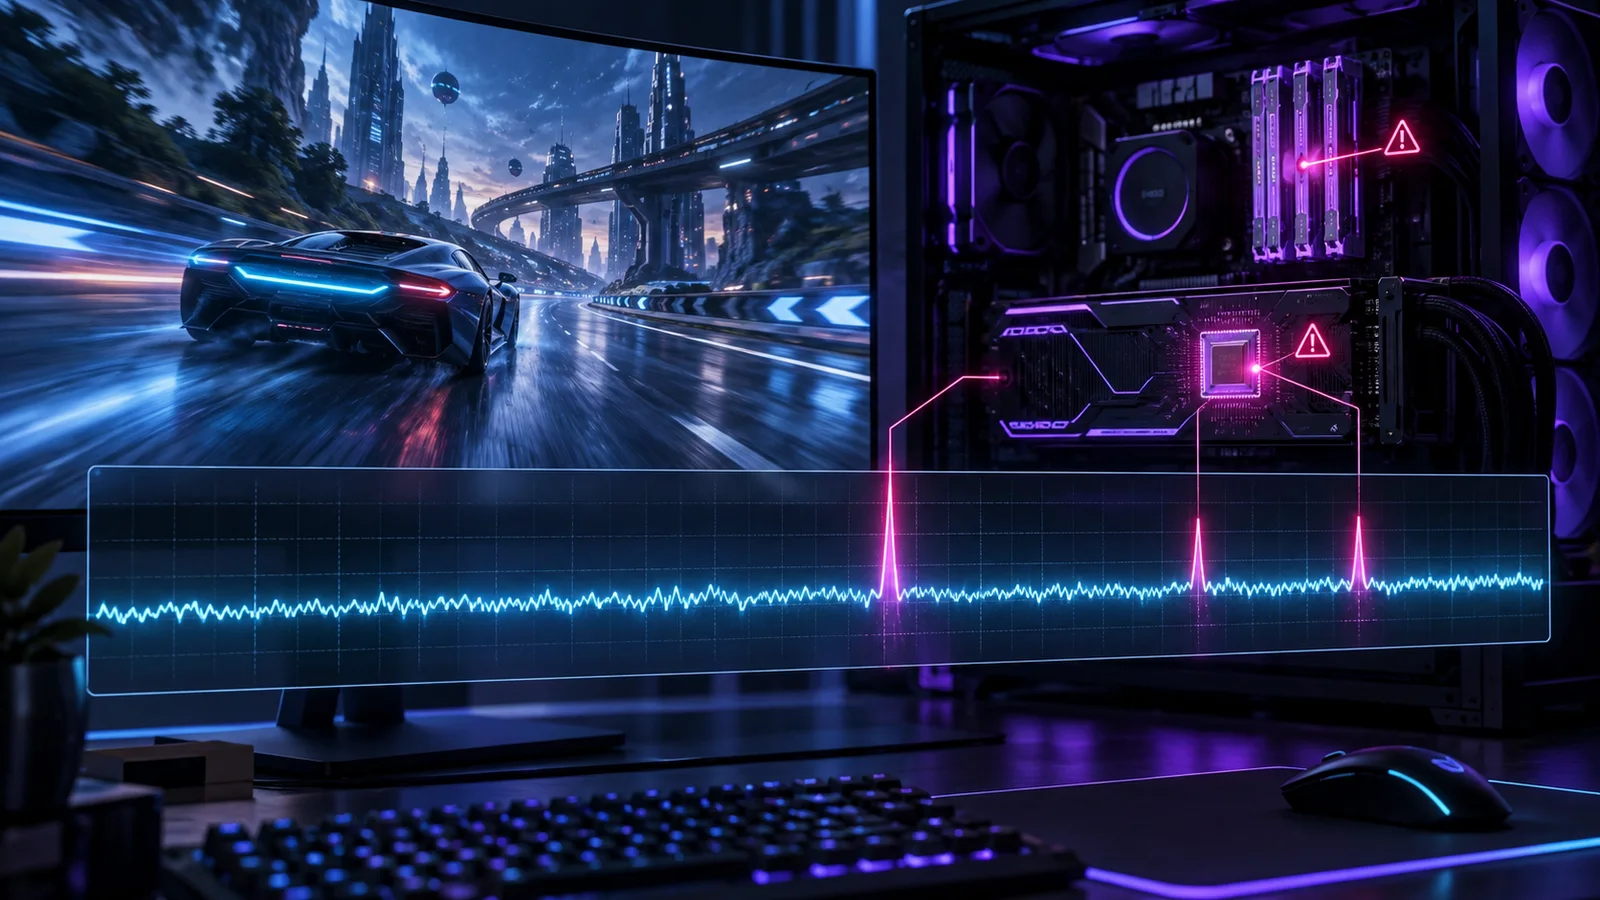
Quick answer: Use a repeatable frame-time check to separate GPU limits, memory pressure, shader compilation and background interruptions.
A game can report a high average FPS and still feel uneven. Stutter appears when individual frames take much longer than their neighbours, interrupting the rhythm of camera movement or input. The useful question is not only how many frames the PC produces, but how consistently it delivers them.
Read frame time beside FPS
FPS compresses performance into a rate. Frame time shows the duration of each frame in milliseconds. A smooth trace stays close to a stable interval. A sharp spike marks a frame that remained on screen longer than expected.
Use a tool that records per-frame data rather than watching one changing average. PresentMon can capture CPU, GPU and displayed frame durations across DirectX, OpenGL and Vulkan applications. Record a short, repeatable route so the graph is easy to compare.
Do not treat one startup hitch as a complete diagnosis. Run the same route twice and note whether a spike happens at the same location, only on the first pass or at random.
Identify shader compilation behaviour
Some games compile rendering work when an effect or environment appears for the first time. That can cause a first-run hitch that becomes smaller or disappears after the relevant shader data is cached.
Microsoft describes shader compilation and first-launch stutter as a major PC gaming problem addressed by Advanced Shader Delivery. If the first pass stutters and an immediate second pass is clean, shader work is a plausible cause. Avoid deleting shader caches repeatedly while diagnosing it, and let any in-game compilation step finish before testing.

Check graphics memory pressure
Textures, geometry, render targets and ray-tracing data all compete for VRAM. When the working set exceeds practical capacity, the game may move resources more aggressively and create visible interruptions.
Start by lowering texture quality one step. Then reduce ray tracing, high-resolution texture packs or settings that increase render-target pressure. Keep the resolution constant during this pass so the result answers one question. A monitoring overlay can provide context, but reported allocation is not always identical to memory actively required by the game.
Separate a GPU limit from a CPU limit
Lower the output resolution or use a quality-focused reconstruction mode. If FPS rises clearly and frame time improves, GPU load was important. If performance barely changes, inspect CPU-heavy settings such as crowd density, simulation, view distance or object detail.
Our resolution guide explains how pixel count changes the GPU workload. If the game offers DLSS, FSR or XeSS, use the upscaling explainer before selecting an aggressive mode.
Remove background interruptions
Close unnecessary capture tools, browser video, launchers and overlays for one clean comparison. Check whether Windows Update, antivirus scanning or a storage sync is active. An unstable overclock, thermal throttling or nearly full system drive can also create symptoms that look like a game setting problem.
Do not disable security software permanently. The goal is a controlled test, followed by a safe long-term configuration.
Build a repeatable troubleshooting order
Use this order so each result stays meaningful:
- Restart the game and finish any shader compilation screen.
- Record the same demanding route twice.
- Check frame time, not only average FPS.
- Lower texture pressure if VRAM is close to capacity.
- Lower resolution to test whether the GPU is the main limit.
- Reduce CPU-heavy settings if resolution barely changes performance.
- Test once without optional overlays and background capture.
- Restore features one at a time after finding a stable baseline.
Keep the conclusion specific
One stutter does not prove that a GPU is too slow, and a high FPS average does not prove that delivery is smooth. Record where the spike occurs, whether it repeats and which single change removes it. That evidence leads to a useful fix and a preset you can trust after the next update.
Official references: PresentMon performance capture project, PresentMon metric definitions, and Microsoft Advanced Shader Delivery.